Compelling narratives
In a world that seems to be increasingly dominated by data, making sense of it all has probably never been harder. At Beyond, we pride ourselves on being able to turn impenetrable tables of figures in to compelling narratives that lead the reader through the challenge of understanding the key issues.
Taking a step back and allowing time to really get under the hood of the data, then applying our creativity to the visuals is one of our specialities. Some of our most rewarding projects have involved a lot of head scratching over some unfathomable data set before the light bulb moment, which leads to an infographic that conveys the vital messages.

DIGITAL
Bringing facts to life
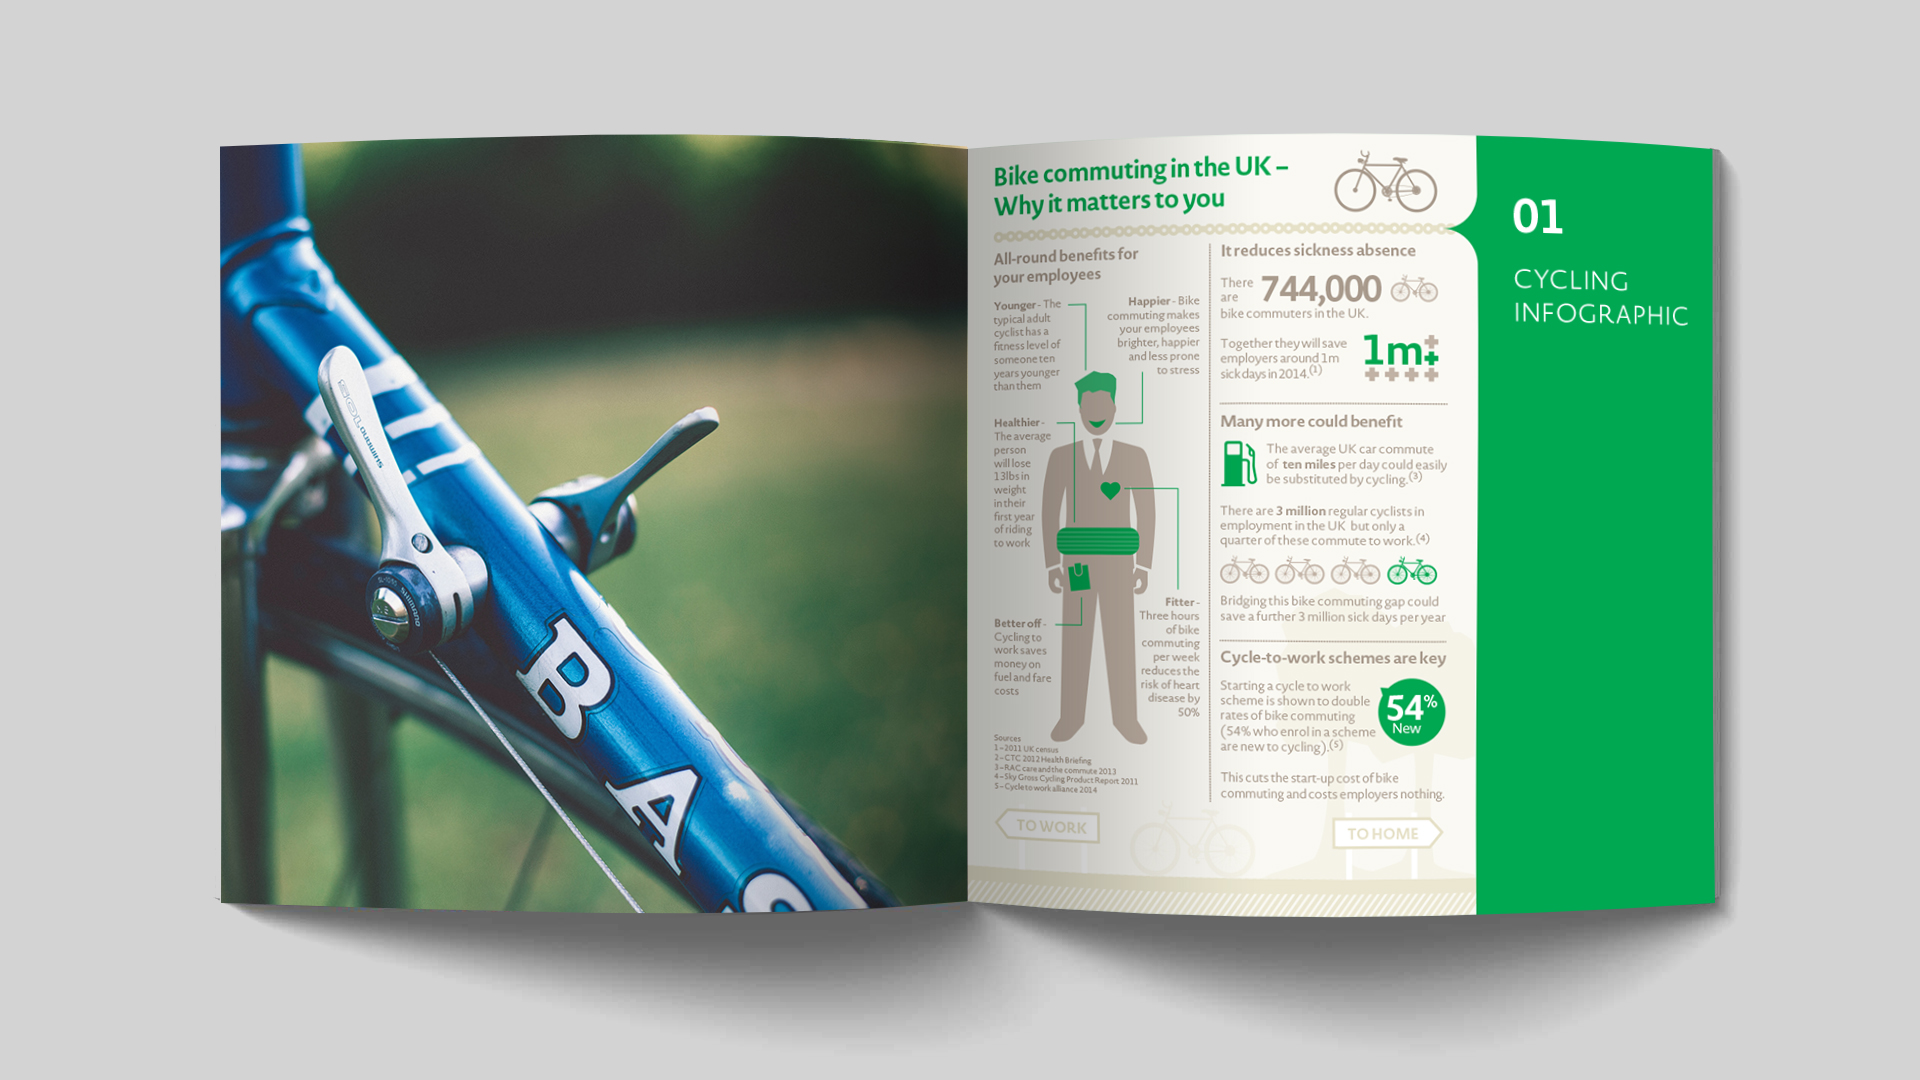
Taking a spreadsheet full of data and teasing out the story is where we are happiest. In this example, research had been commissioned in to the benefits of cycling to work. Our client provided HR and rewards advice and used this piece to help sell their cycling rewards scheme that they ran on behalf of their partners.

DIGITAL
DESIGN
Beyond the pie chart
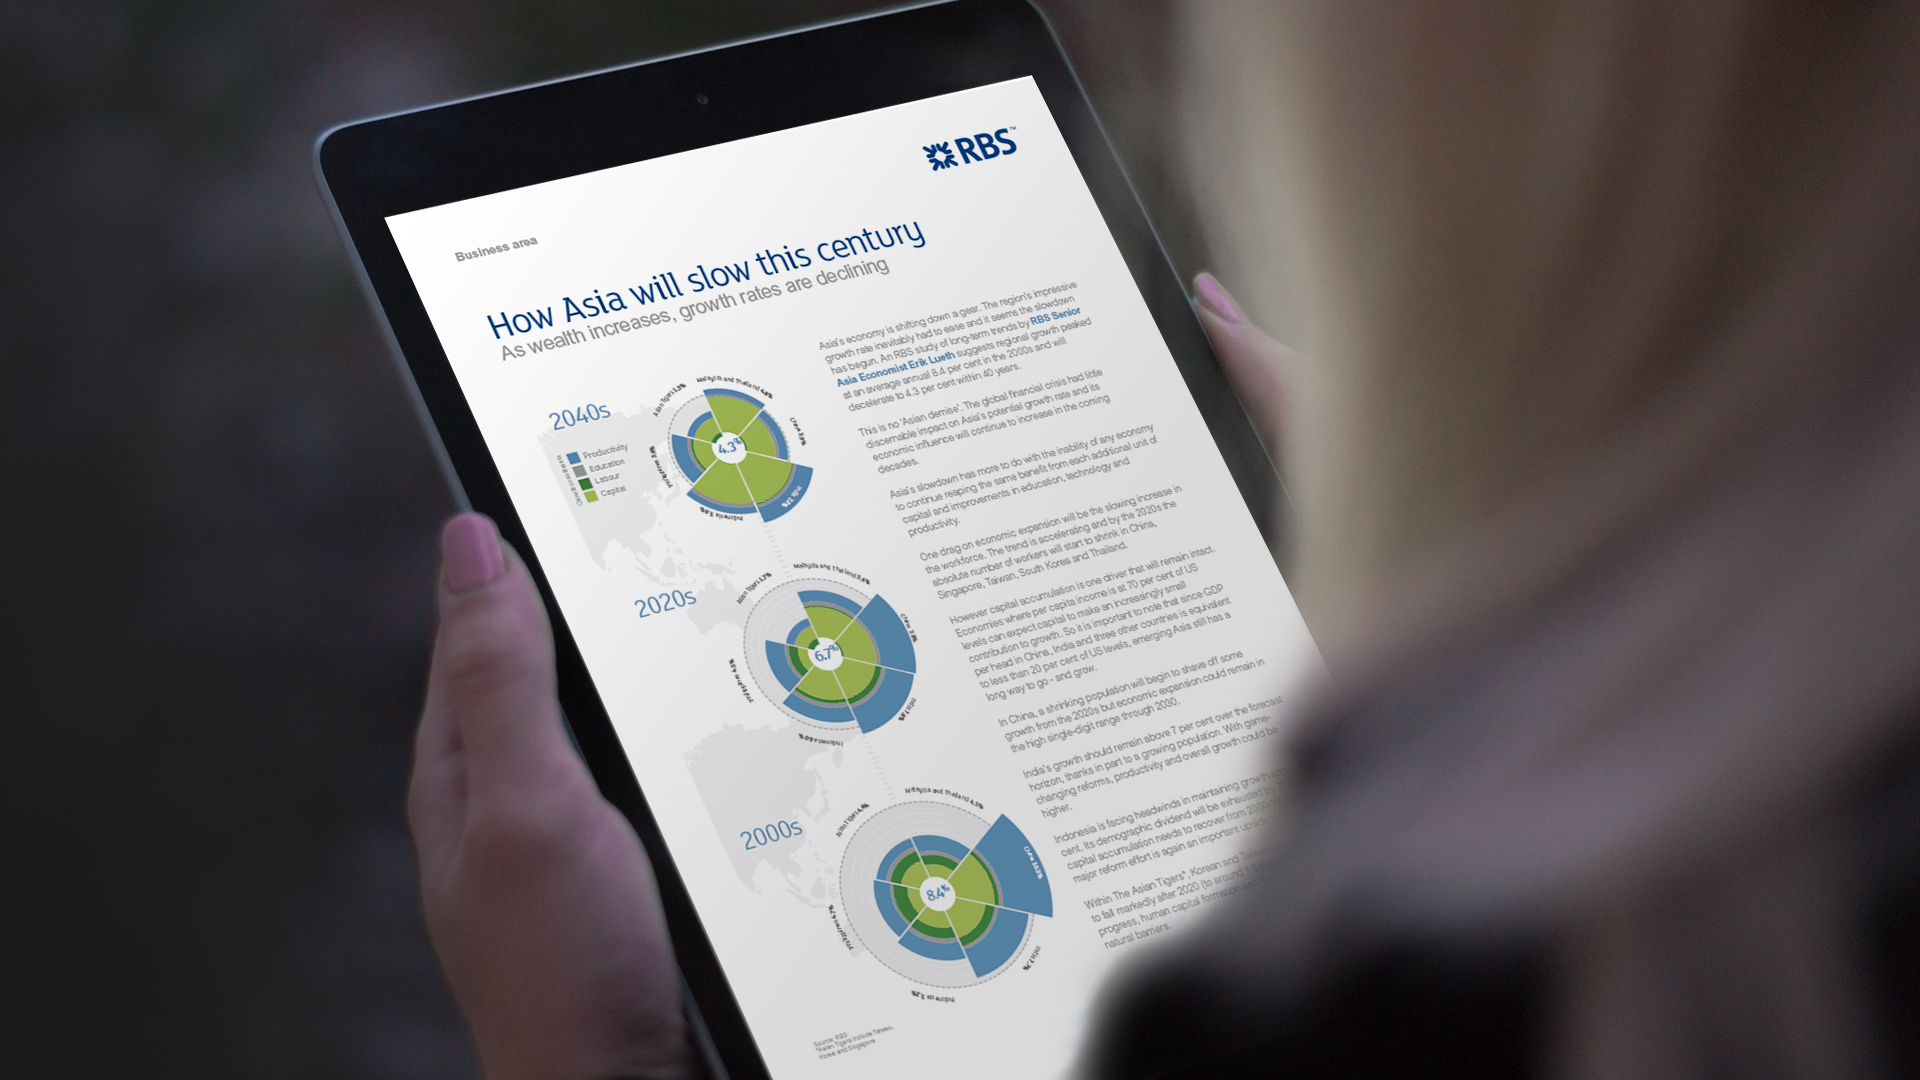
The interpretation of the data depends entirely on the audience and the core message, in some cases, we develop visual tools to overlay multiple pieces of content in one place in a way that is easy to digest and compare.

BRAND DEVELOPMENT